The Keeling Curve is the iconic record of global atmospheric carbon dioxide (CO₂) measurements over time.
Spanning from 1958 to the present day, it is the longest continuous record of atmospheric CO₂ in existence. CO₂ measurements are taken at the Mauna Loa Observatory in Hawaii, and the data are representative of the global atmospheric CO₂ concentration due to the pristine nature of the sampling location.
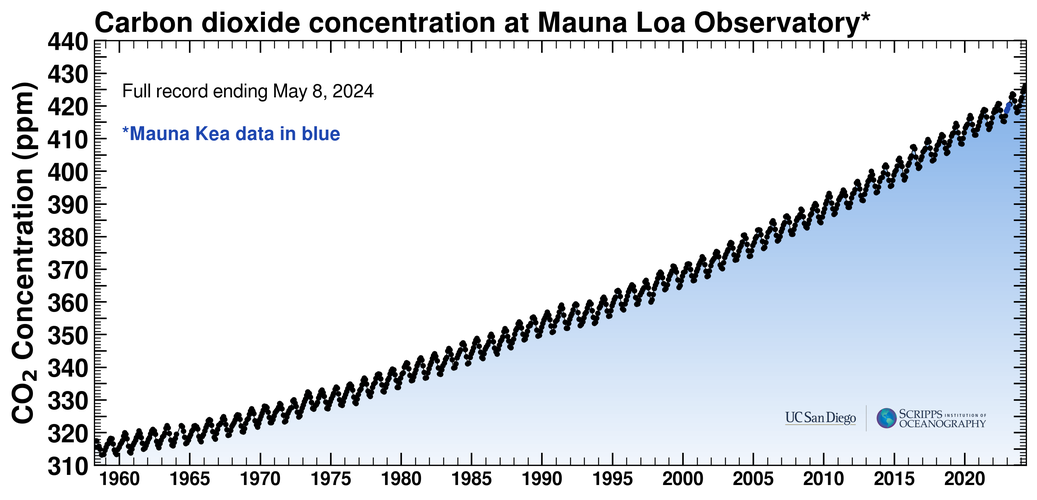
The Keeling Curve, named for Charles David Keeling, is a graph of atmospheric carbon dioxide (CO₂) concentrations measured in parts per million (ppm).
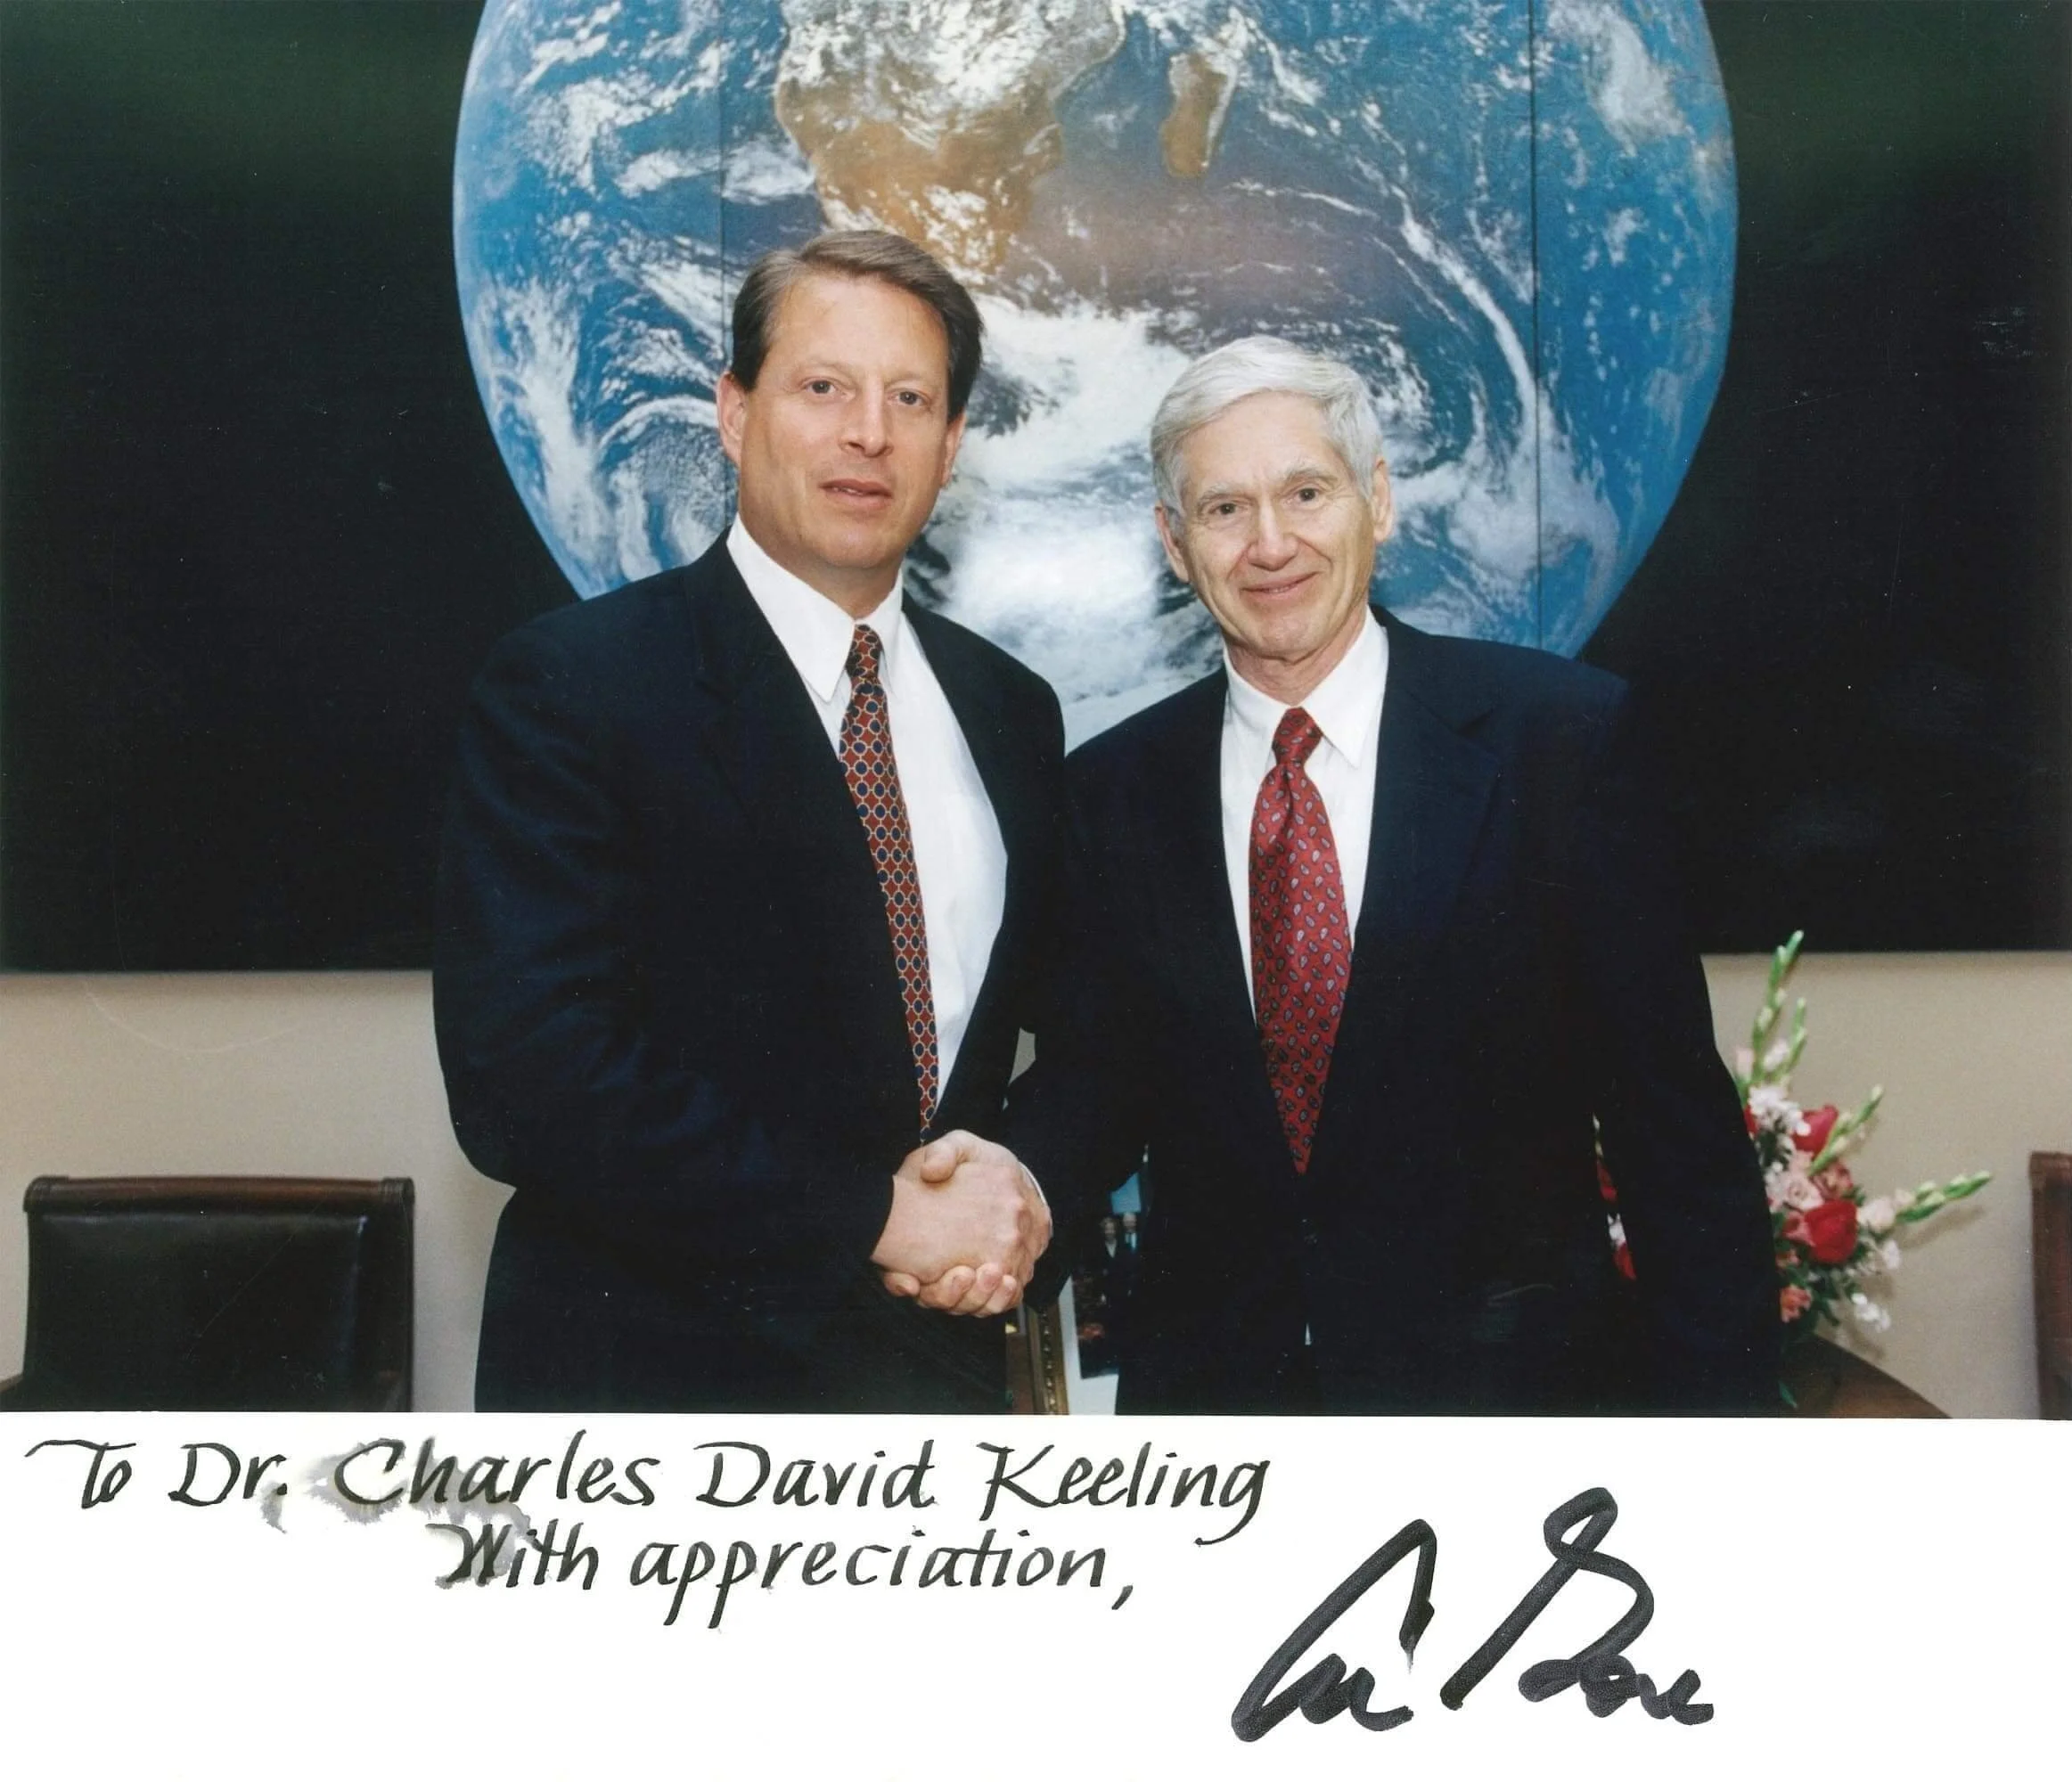
The Keeling Curve is named for Charles David Keeling, the founder of the atmospheric CO₂ sampling program
He operated the program until his passing in 2005, when his son Ralph F. Keeling took up the mantle. The program is ongoing, and the data is maintained and managed by Scripps Institution of Oceanography (SIO) at UC San Diego in La Jolla, California.


As atmospheric CO₂ concentrations continue to rise, the Keeling Curve has become a symbol of the impact that human activities have on our planet's climate
It is also seen as a testament to the enormous value that precise and continuous data sampling – along with unwavering persistence and dedication – brings to the body of scientific knowledge and humanity as a whole.
The Keeling Curve is considered the single most important environmental data set taken in the 20th century.
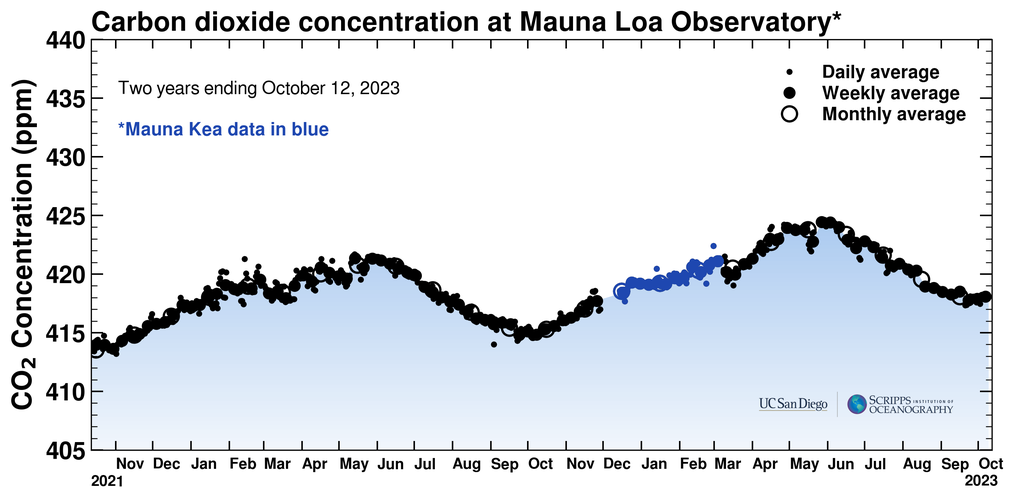
Keeling Curve Data from 2022 - 2023
Tracking these data over time has allowed us to see patterns and predict future readings.

The History
Charles David Keeling graduated from University of Illinois in 1948, and he received his PhD in chemistry from Northwestern University in 1954. In 1956 as a postdoctoral fellow with California Institute of Technology, he determined how to make extremely precise measurements of atmospheric carbon dioxide. He was affiliated with Scripps Institution of Oceanography at University of California, San Diego, for the rest of his career.

Charles David Keeling initially recognized the need for a robust and accurate data set to establish a baseline value of atmospheric CO₂.
Dr. Keeling began began taking continuous atmospheric CO₂ measurements at Mauna Loa starting in 1958. As he gathered more data, he additionally realized the need to better understand seasonal fluctuations that are now described as the breathing of the planet (i.e. plant photosynthesis and respiration), and to record continually rising atmospheric carbon dioxide concentrations. These measurements continue to this day and have become the data set known as the Keeling Curve, which is considered the single most important environmental data set taken in the 20th century.
These measurements continue to this day and have become the data set known as the Keeling Curve, which is considered the single most important environmental data set taken in the 20th century

A Robust Climate Record
The Keeling Curve data show rising atmospheric CO₂ concentrations over time.
CO₂ measurements are taken at the Mauna Loa Observatory in Hawaii, and the data are representative of the global atmospheric CO₂ concentration due to the pristine nature of the sampling location.
Burning fossil fuels releases CO₂ to the atmosphere and contributes to the greenhouse effect by trapping more heat in the Earth's atmosphere, and this impacts the long-term weather, or climate, around the globe. In this way human activities are significantly impacting the Earth's climate system, resulting in anthropogenic (or human-caused) climate change. The Keeling Curve was – and will remain – instrumental in recording the impact of humanity's actions on the Earth.
Explore Our Resources


PHOTO CREDITS Dave Keeling in the lab: UCSD Digital Collections, Dave Keeling and Al Gore: The Keeling Family, Ralph Keeling air sampling: Ralph Keeling, Dave Keeling air sampling: The Keeling Family, Dave Keeling at the board: The Keeling Family